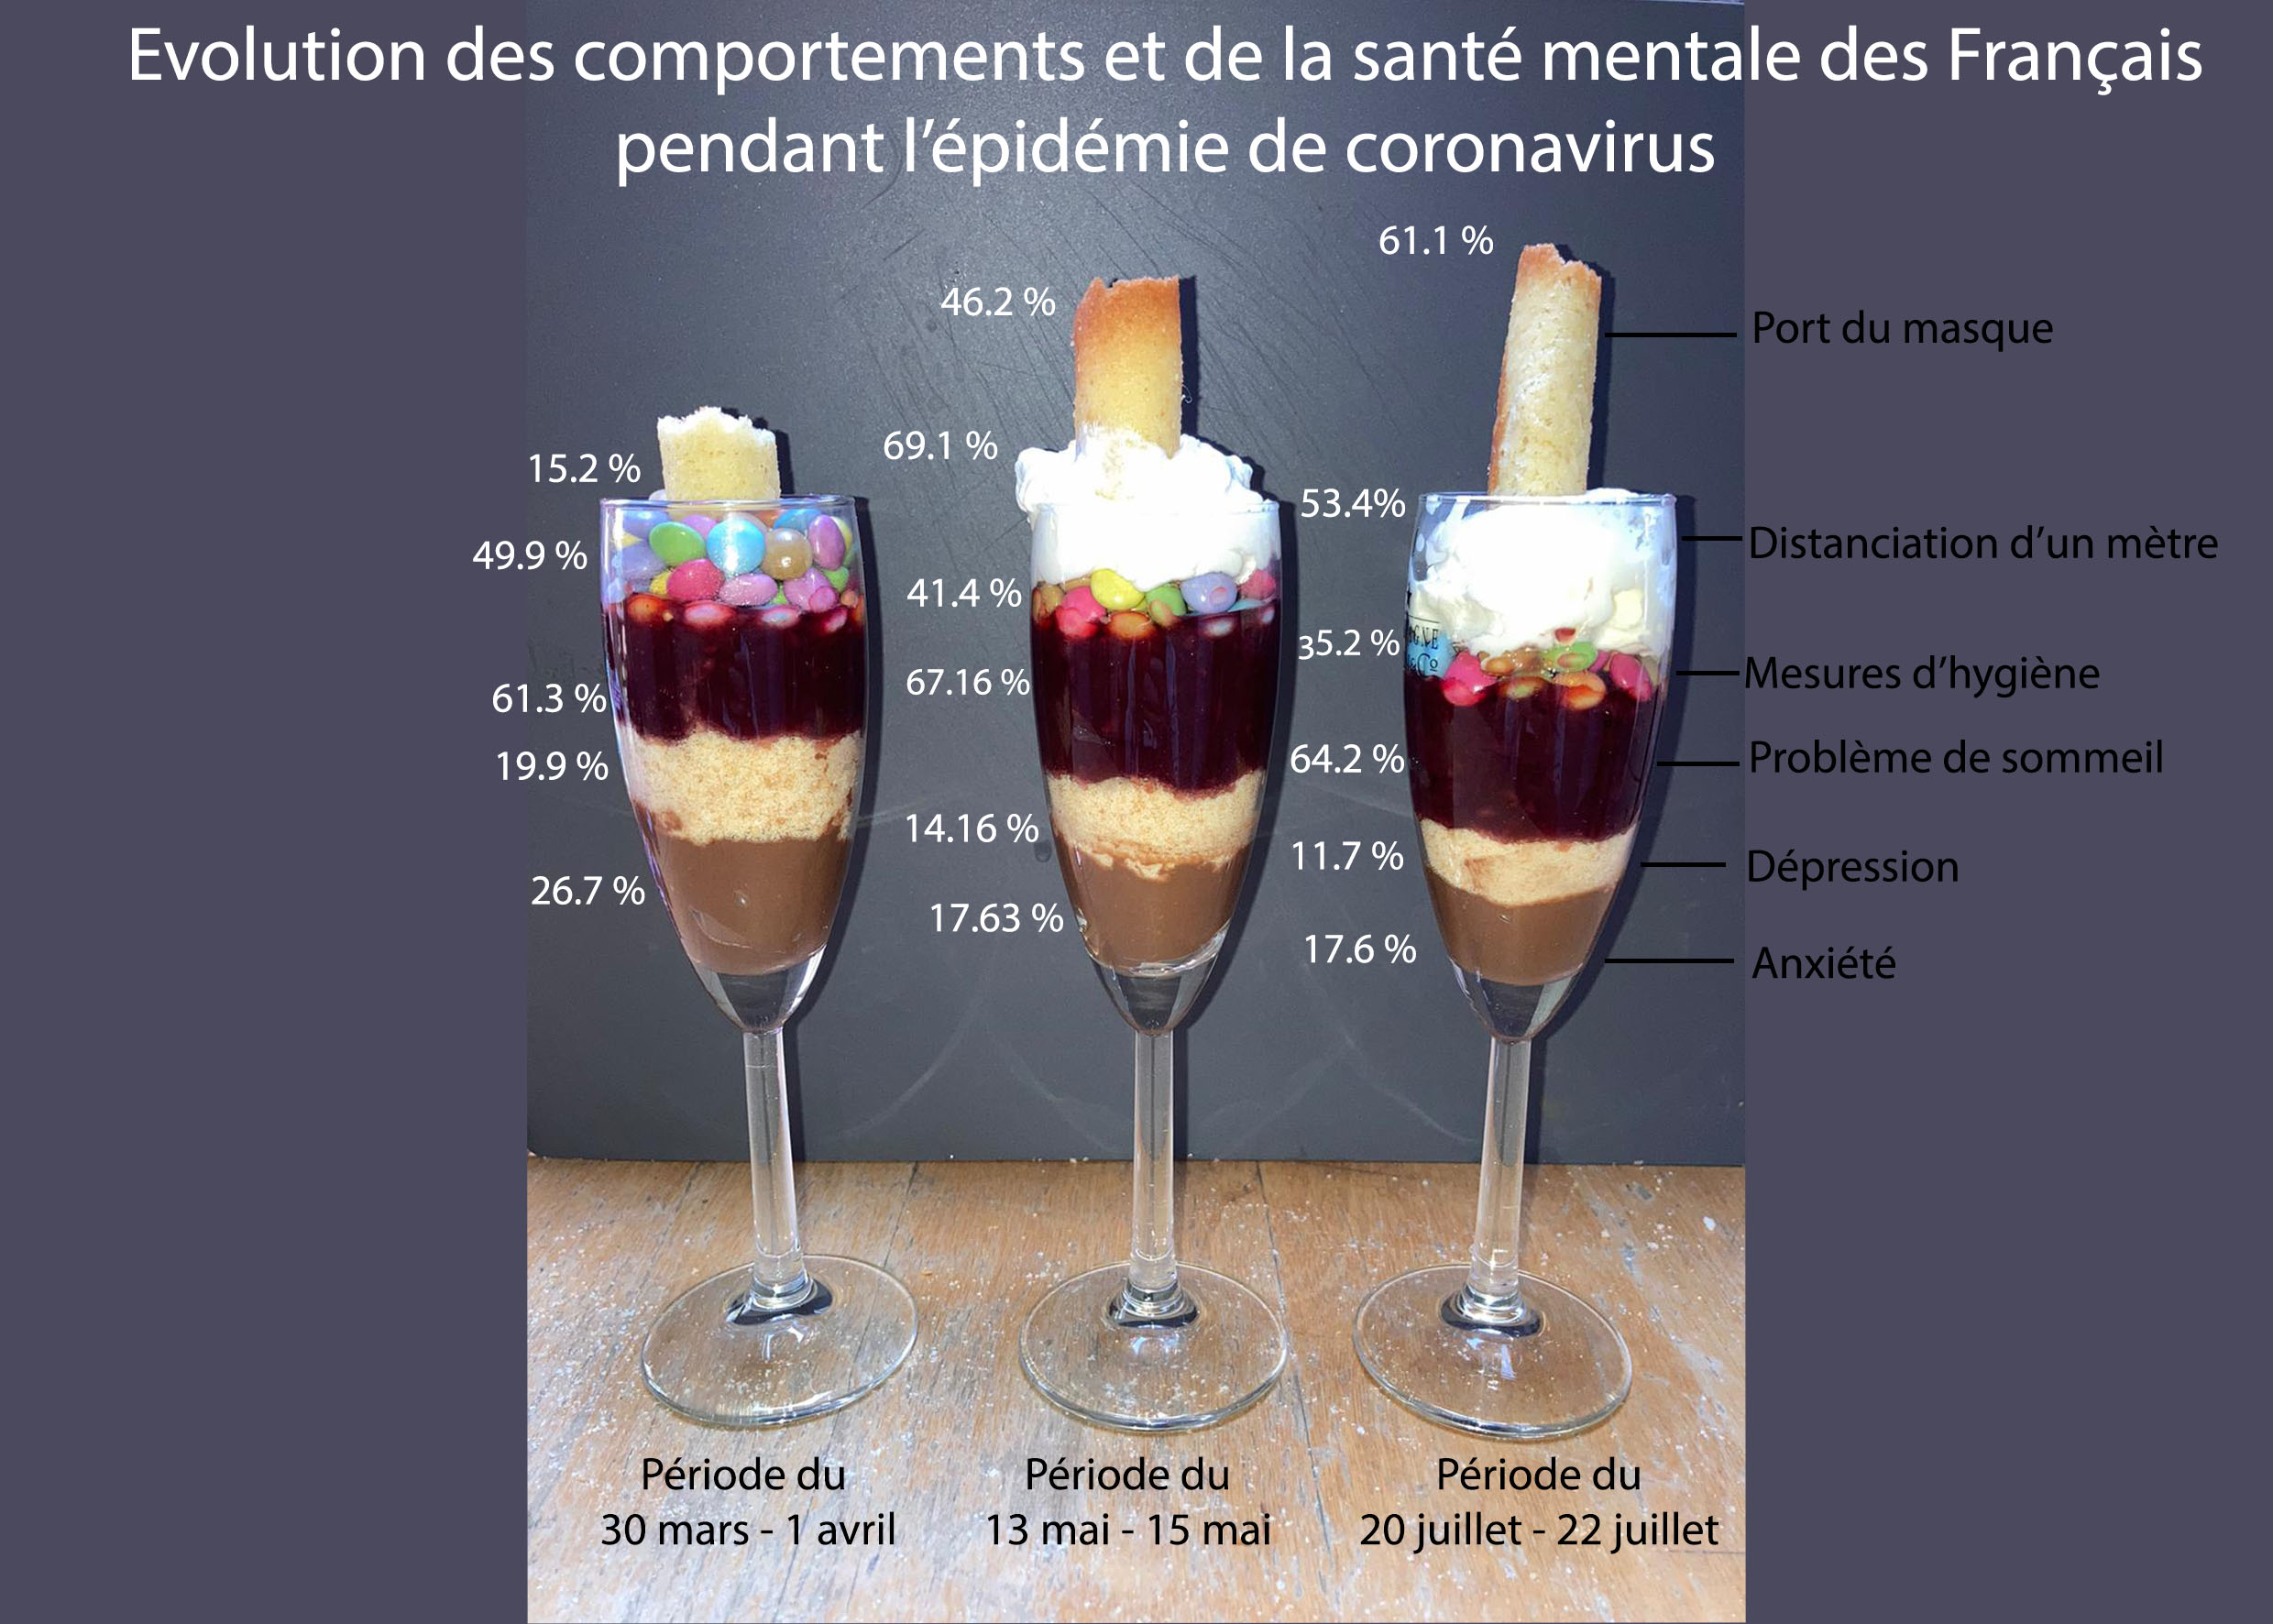
In her video, inspired by data cooking in the manner of Susanne Sujaschko, Jeanne Le Priellec represents the evolution of behaviors and mental health of the French during the first confinement.
She represented three key moments: the beginning of the confinement, during the confinement and the post confinement. Her data show the impact of economic factors on the mental health of the French and underline the importance of supporting, especially during this pandemic period, people with psychological vulnerability (anxiety, depression, sleep disorders etc...).
* Data visualization is a set of processes that allow for the visual representation of data.
Aix-Marseille University (AMU) follows CNIL guidelines
The platform that broadcasts this content conditions its reading to the deposit of tracers in order to offer you targeted advertising according to your navigation.
By clicking on 'I authorize', the cookies will be deposited and you will be able to view this content.